
- Joined
- Mar 5, 2016
- Messages
- 59
- Reaction score
- 100
- Points
- 33
Anyone that knows of me via my previous Subaru and A45 project threads will appreciate I like to delve that little bit deeper with my project threads, at least in respect of the kind of testing and information I like to gather and share. I aim to ensure this RS3 project thread is no different.
What I aim to do is go into detail about what’s being done, why it’s being done and be utterly truthful about the results, supported by as much evidence as possible. I’m not going to state I’m looking to reinvent the wheel, but there is no harm in aiming to make a wheel better! I’m quite excited with the potential development areas that could be investigated.
I’m a “privateer” and enthusiast, so have nothing to gain from this…… other than I absolutely love doing this kind of thing, and love to learn and experience new things. If at least one other person finds this project interesting…… that’s a mega bonus!
My previous performance car was an AMG A45, which after going through a modification project, ended up being the quickest A45 down the drag strip in the UK. Didn’t break any “real drag” records, but it achieved a decent time of 11.80s. Not bad considering it was a hatch with pretty basic levels of tuning.
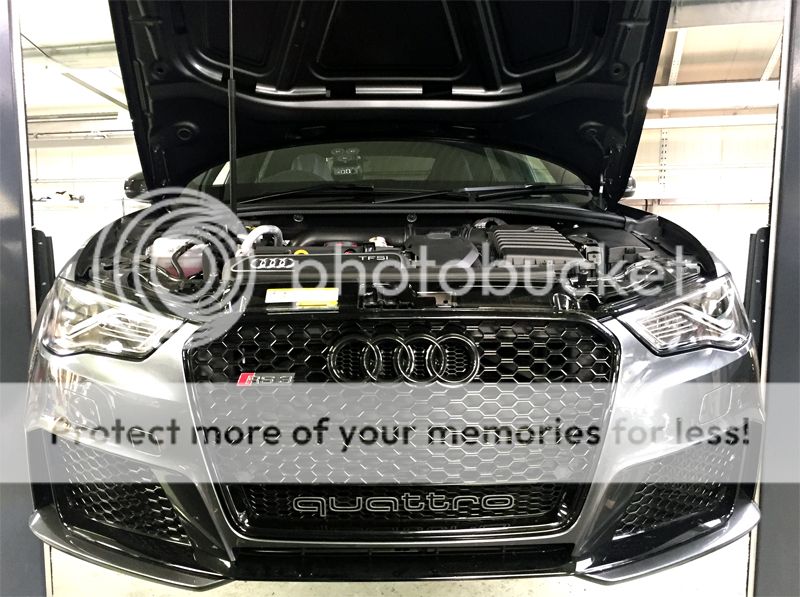
So… A45 move over. Here’s the RS3!
Why did I swap out for an RS3 then?
Being totally honest….. the limited tuning available for the A45, with the Achilles heel being the transmission.
I went out and bought an RS3, pretty much fully loaded…… the kicker being that based on what has already been done with the 2.5 engine, pretty extensive levels of tuning are available. Just up my road then! Lol
Approach - Project Roadmap
Obviously I can’t do this on my own, as the amount of resources needed to do this kind of project approach justice, is more than my brain, skill and hands can cope with. So I’ll be working with a number of “professionals” along the way, but more on that once we get things underway.
The areas I would like to cover/investigate are (we’ll have to see if all these come to fruition - although certain areas have already been discussed with the individual's I’ll be working with):
Tuning Box
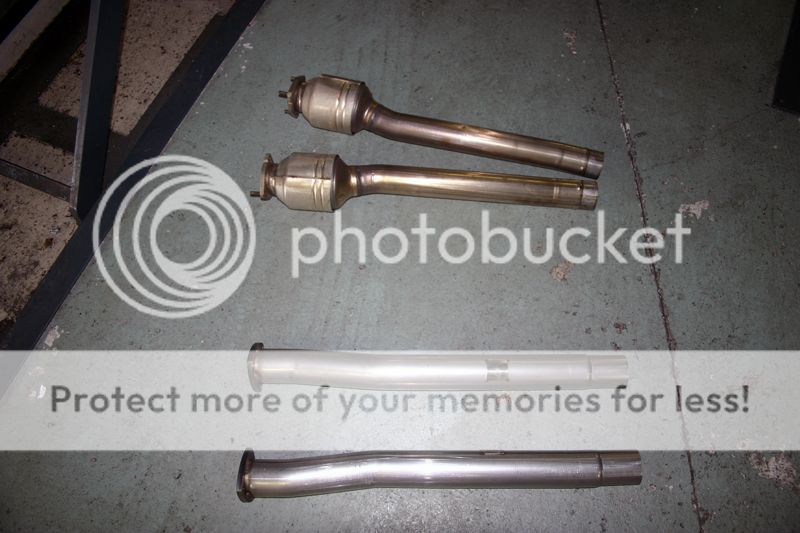
Secondary Decat pipes
ECU remap
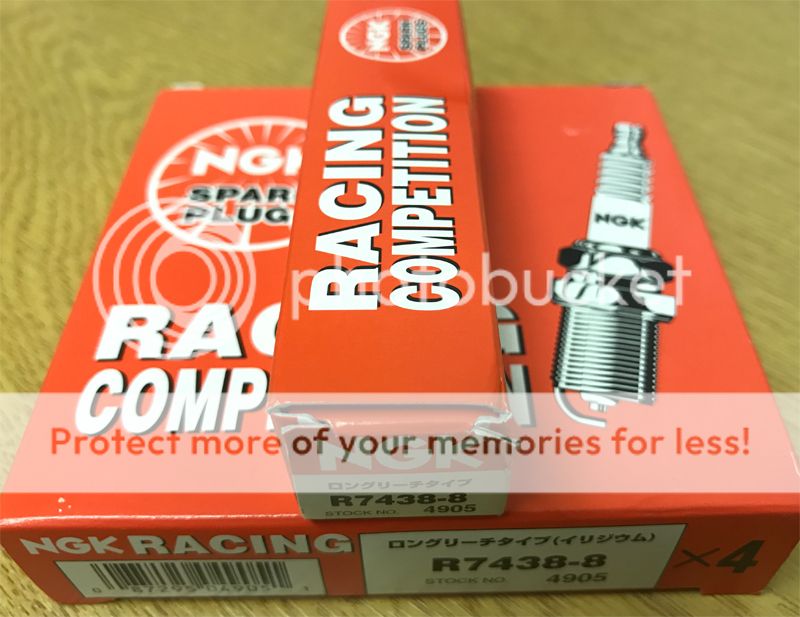
Uprated plugs
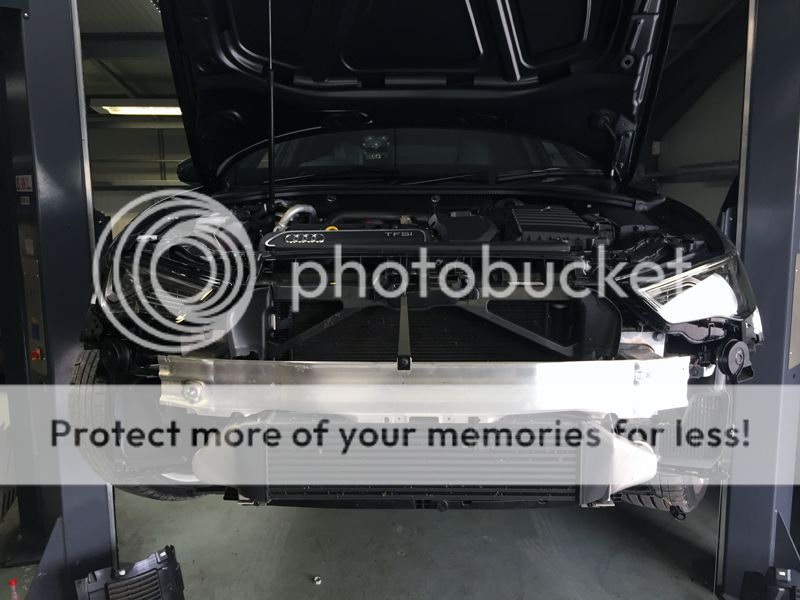
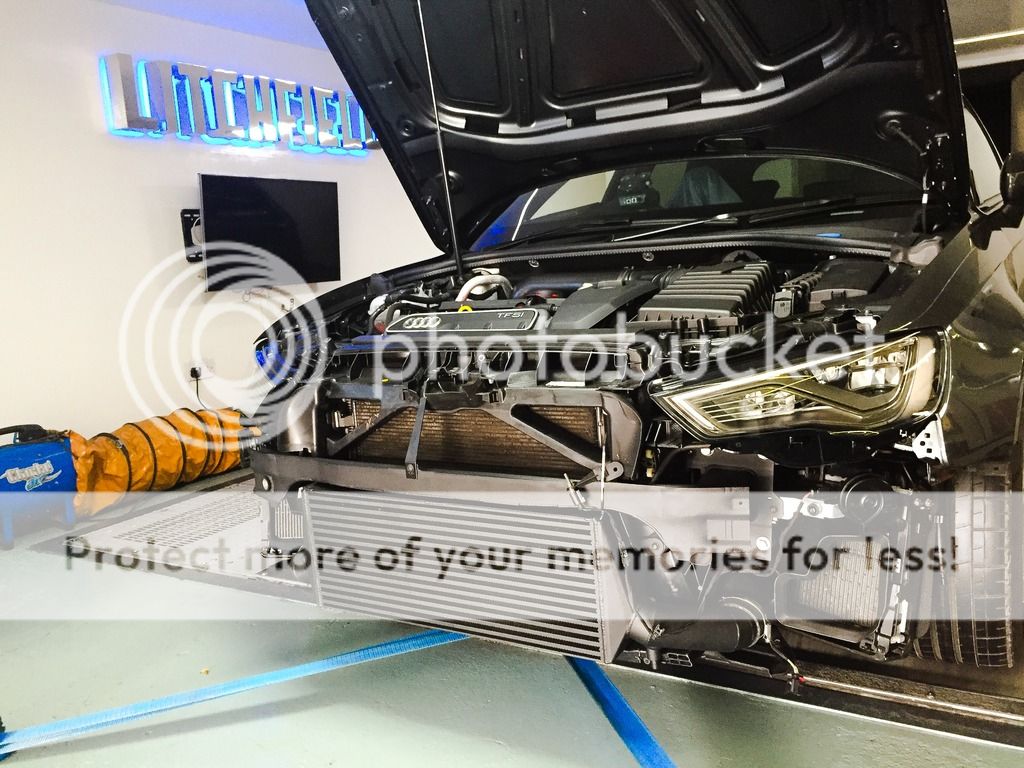
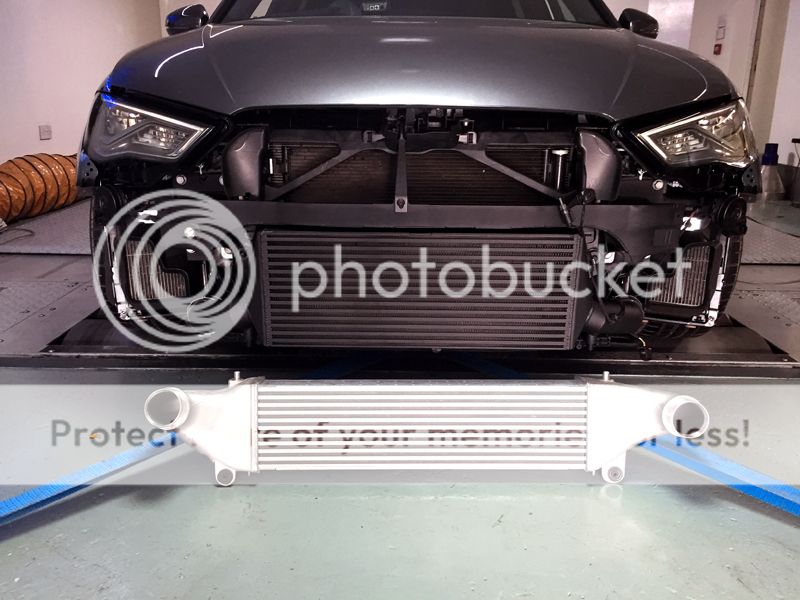
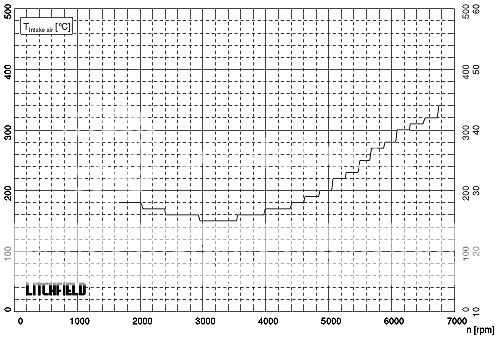
Look at intercooler and inlet efficiencies at this level, look at testing upgrades if warranted
Turbo (along with remap and again looking at intercooler and inlet efficiencies).
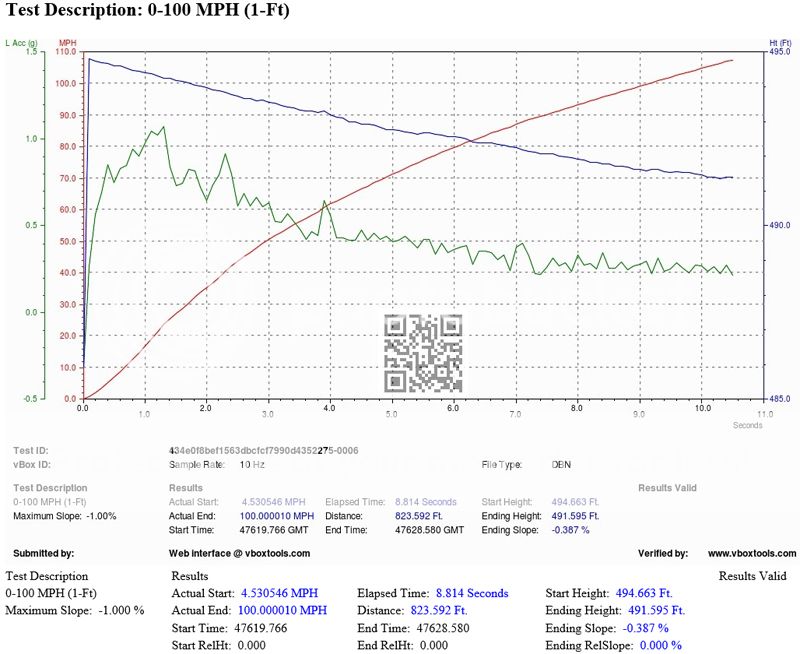
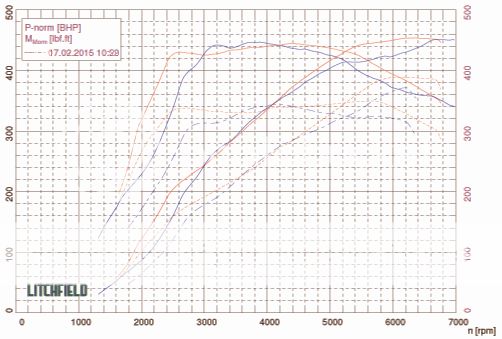
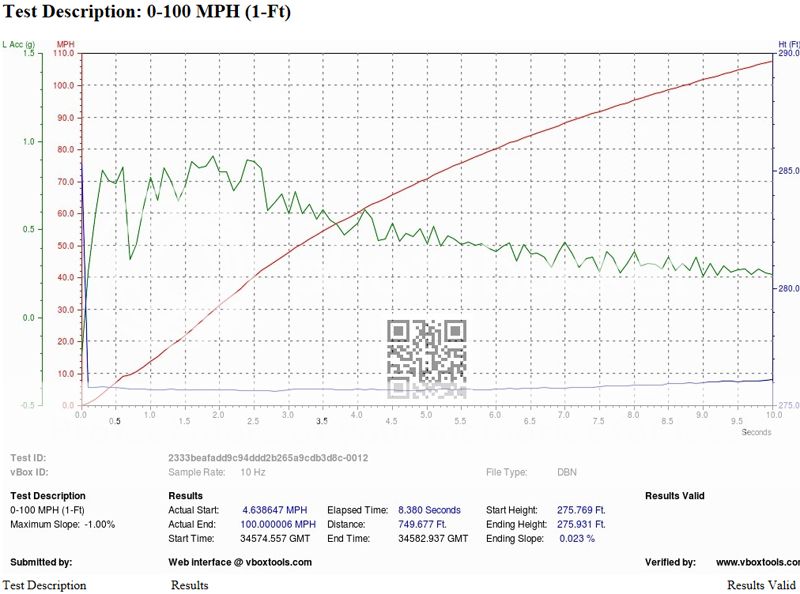
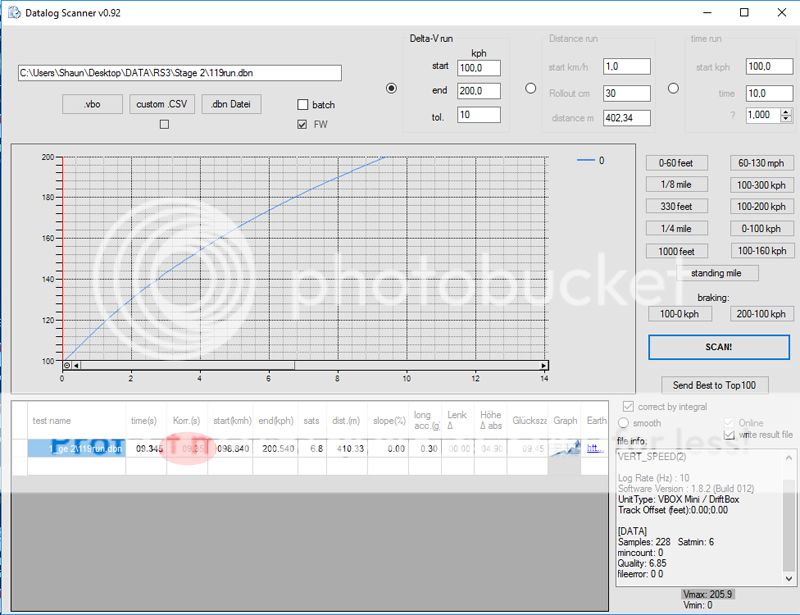
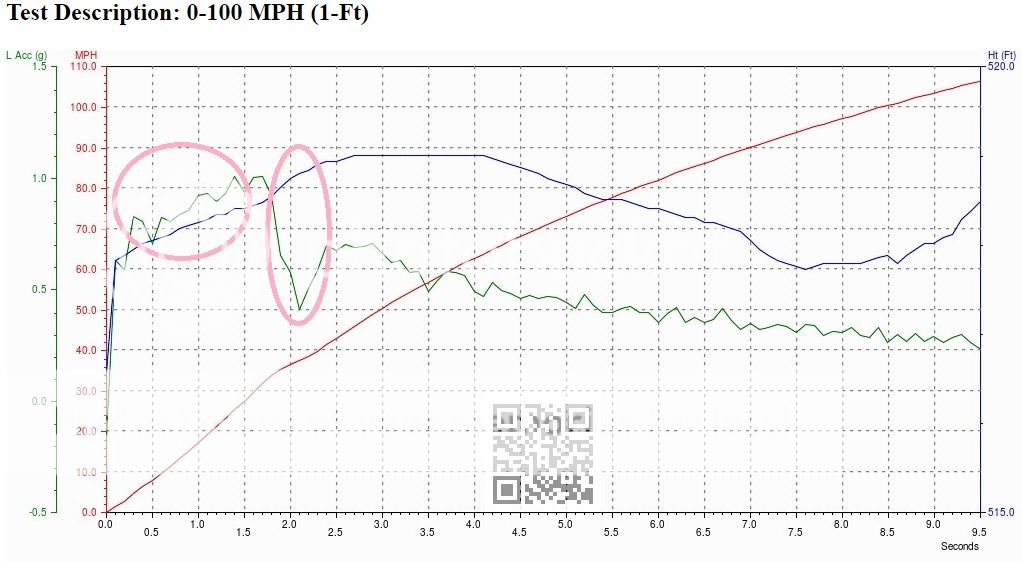
End target is at least 500bhp - ideally looking to get in the 10’s down the strip, but this will probably need quite a bit more than 500bhp - we’ll see how this all goes.
This is all very very high level, but gives an idea of the kind of steps I’ll be looking to take. Depending upon how the car reacts, I may look at chassis / suspension / braking mods. I will also be undertaking some subtle styling mods... just to jazz things up a touch. Nothing too "Halfords" though.... don't worry!
So…. that’s enough of the introductory stuff.
The next update will be coming your way soon - so let the fun begin guys. First round of performance mods and testing will be starting at the end of August.
I really hope (and encourage) for you all to get stuck in and feel free to contribute to this open discussion thread.
What I aim to do is go into detail about what’s being done, why it’s being done and be utterly truthful about the results, supported by as much evidence as possible. I’m not going to state I’m looking to reinvent the wheel, but there is no harm in aiming to make a wheel better! I’m quite excited with the potential development areas that could be investigated.
I’m a “privateer” and enthusiast, so have nothing to gain from this…… other than I absolutely love doing this kind of thing, and love to learn and experience new things. If at least one other person finds this project interesting…… that’s a mega bonus!
My previous performance car was an AMG A45, which after going through a modification project, ended up being the quickest A45 down the drag strip in the UK. Didn’t break any “real drag” records, but it achieved a decent time of 11.80s. Not bad considering it was a hatch with pretty basic levels of tuning.
So… A45 move over. Here’s the RS3!
Why did I swap out for an RS3 then?
Being totally honest….. the limited tuning available for the A45, with the Achilles heel being the transmission.
I went out and bought an RS3, pretty much fully loaded…… the kicker being that based on what has already been done with the 2.5 engine, pretty extensive levels of tuning are available. Just up my road then! Lol
Approach - Project Roadmap
Obviously I can’t do this on my own, as the amount of resources needed to do this kind of project approach justice, is more than my brain, skill and hands can cope with. So I’ll be working with a number of “professionals” along the way, but more on that once we get things underway.
The areas I would like to cover/investigate are (we’ll have to see if all these come to fruition - although certain areas have already been discussed with the individual's I’ll be working with):
Tuning Box
Secondary Decat pipes
ECU remap
Uprated plugs
Look at intercooler and inlet efficiencies at this level, look at testing upgrades if warranted
Turbo (along with remap and again looking at intercooler and inlet efficiencies).
End target is at least 500bhp - ideally looking to get in the 10’s down the strip, but this will probably need quite a bit more than 500bhp - we’ll see how this all goes.
This is all very very high level, but gives an idea of the kind of steps I’ll be looking to take. Depending upon how the car reacts, I may look at chassis / suspension / braking mods. I will also be undertaking some subtle styling mods... just to jazz things up a touch. Nothing too "Halfords" though.... don't worry!
So…. that’s enough of the introductory stuff.
The next update will be coming your way soon - so let the fun begin guys. First round of performance mods and testing will be starting at the end of August.
I really hope (and encourage) for you all to get stuck in and feel free to contribute to this open discussion thread.