Prosport Rolling road day results

Here is my RR graph - 8P S3 with Bluefin installed since June 3rd 2008 running Shell V-Power or Tesco 99 since new.

Any comments gratefully recieved - still planning on visiting SuperChips to see what they have to say.

RR.jpg
 
is it just me, but if a whole load of cars make similar figures, all far higher than expected (including my own) why is there a tendency to claim fantastic bhp figures rather than the assumption that the rr readings are over for everyone?

it does seem very odd to me - there is no way my 2.0tdi was makeing 187hp stock.

the way a roller works measuring wheel torque then using the rundown to estimate drivetrain losses, and adding a fudge factor to come up with a flywheel figure is prone to significant miscalculation - thats why i rollered mine with the standard map then with the remaps as a comparison.
 
Could we get people to post their RR graphs from the day?
I'm really interested to see the difference.
Be good if we could have:
Standard - Phantom and L6ON
GIAC - Quick Nick and KRSI (and Jonnyc's to completely shame everyone!)
Revo - S3izzo
Bluefin - IGGU

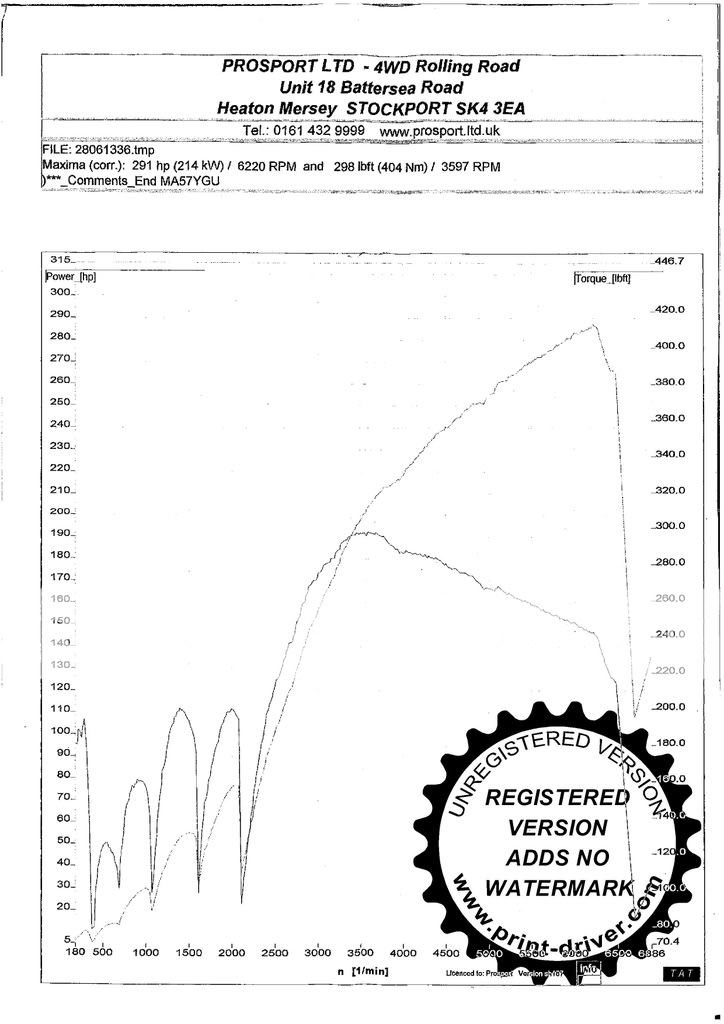
Phantom - do you think prosport hold electronic copies of the plots???? might make it easier??

My plots in the other thread , Bluefin thrread, i'll stick it up here as well.

ScannedImage-2.jpg

Kontraband can you scan in your plot as mine has a spike in , your will be more level.
p
 
yeah, will do... but am out the office tomorrow and Thurs so it'll be more like Friday ;)
 
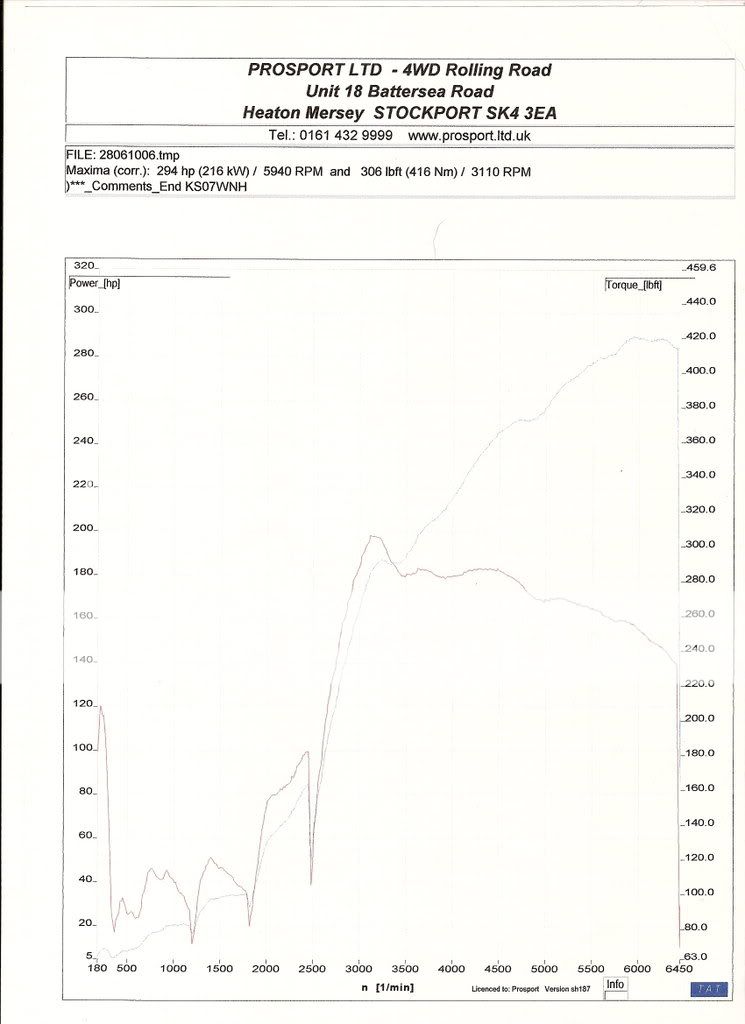
Even if I saw it with my own eyes I still would believe they all produced 290bhp.

It's the 3rd time for my car staz on two different RR's on three different days.

Ive also seen Mitch78's car do it , and the other 4 cars from saturday do it!

:wub:

p
 
Heres my plot, no scanner at home but i hope you can see it. (Standard car running Tesco 97ron all the time)

IMG_1210.jpg
 
good idea... take a photo of it...

should get mine on when I get home then.

edit> After Ive moved the tonne of stone thats being delivered and left infront of my garage! :think:
 
Why are all the torque graphs bouncing up till about 2500 rpm? Is it wheel spin??
 
123.jpg


Run on only Vmax for first 1000 miles and Tesco 99 for 2nd thousand. Only done short trips... had some good ragging, run in quickly by sealing the joints. Other than that, totally standard unless recaro kid seats make it go faster! ;)


tits, its the wrong way round... hold on....

thats better.
 
Run on only Vmax for first 1000 miles and Tesco 99 for 2nd thousand. Only done short trips... had some good ragging, run in quickly by sealing the joints.


tits, its the wrong way round... hold on....

thats better.

You Pa-lonka!!! :)
 
hahaah its sorted! I edited it in photobucket and that was showin it the correct way... weird...
 
Just having a quick look at the plots wev'e posted , i'm hitting peak power and peak torque before the rest of you's inc IGGU and the Bluefin?

p
 
I want Kontraband's torque - look how steady it is between 3000 and 4500. Bet that's some shove.
 
No.. its MY torque.

Actually, thats one of the things Ian (is it Ian at prosport?) said about my graph... that is was smoooooooooth. Apparently thats a really good one! ;) I dunno... I get in the car, point, and press!
 
Peter ( owner , fella at the computer ) Andy the driver.

It's a nice curve mate , not like mine a wild kick in the back spike. you can tell mines been floored a lot! :scared2:

A nice remap should smoooooth that out though.

p
 
aye, Peter... thats the fella.

Will be interesting yeah, to see the remap on yours.
 
Here's my plot from Saturday. GIAC Hammer running Shell V Power from new
RRPlot.jpg
 
Has anybody got the skills/programs to overlay them?

I'm having a go using FELT TIP pens for the different colours for each person , but it looks biz!

p
 
I know that the prints are from temp files, but you think prosport would have an e- copy?
 
Not got a clue mate , but there must be some computer whizz kids on here.....Mitch78??????????? lol

p
 
It's the 3rd time for my car staz on two different RR's on three different days.

Ive also seen Mitch78's car do it , and the other 4 cars from saturday do it!

:wub:

p

I'm still sceptical. I can understand that there will be some more power than standard when running higher octane fuel but I don't believe 290.

Not got a clue mate , but there must be some computer whizz kids on here.....Mitch78??????????? lol

p

One way you could overlay them is make each one a GIF and delete all but the curves. Add each one as a layer and you'll see all the graphs together when you flatten the layers.
 
If you overlay them as layers in photoshop and change the opacity of each layer that should work, you may have to highlight the lines in different colours as there's that many it would probably look a mess.....perhaps do one for torque and one for bhp?
 
We only need three plots layering in.

QuickNicks , Iggu's and idealy Kontrabands ( because he has no spike ) , but as it's a photo it may be to hard, if it is use mine.

Shame Jordans is not around though!.

p
 
The Axis are different on each graph (or the Std vs GIAC I just had a go at) so it's not a true match.

stdgiac.jpg
 
Some feedback from Jamie at SuperChips after I'd emailed him my graphs:

Two immediate observations, firstly there does not appear to be an inlet temperature correction, our dyno plots this so you can see it rise as the intercooler heats up and secondly the graph terminates prematurely at a peak power of 291bhp at 6220 rpm. We see power right up to the rev limiter.


I did think it was odd on the day that all the cars only seemed to be revved to just over 6000. With Bluefin on mine doesn't rev out at all and keeps pulling to 7200 and maybe more.

Any views on this ?
 
I'm not sure about the power dropping off mate , but the inlet temp thing is a bit of a cop out as we all run on the same day , so we all " roughly " would have had the same inlet temps unless some cars were poorly or running crazy settings!

p
 
Just had a look at my plot from the Awesome RR day , yes it does rev to 7K , but the power starts droping off from 6K so there is no need to carry on , coz the power's not gonna go back up once it's started falling.

I recon Peter clicked the mouse AFTER it made peak power thats why it " drops off " instead of falling slowly.

Either way wev'e seen the peak power output for the cars.

p
 
Whether you believe them or not is another matter entirely.

Have you had your car on the Rollin road Std or Bluefin'd?

So you don't know mate.

You have seen the plots Std and remapped , Prosport don't know the cars , they just ran them , the figures are from the RR , were the ones who know if a cars Std , mapped , or whatever.

If you don't want to believe the figures to try and justify your outlay on a Bluefin then thats up to you my friend. :happy:

IMHO two rolling roads and 6 cars minimum can't be wrong :icon_thumright:

p
 
Have you had your car on the Rollin road Std or Bluefin'd?

No I haven't, but I have seen many other RR printouts on this very site claiming 280bhp also. And quite a few people have said they are getting 261 or there abouts. So why do some cars have 261, some 280 and some 290?

They don't.

Do you really think the computer that programs the ECU on the Audi production line just makes up whatever map it feels like? Do you really think Audi themselves would want to make the S3 map more powerful than the TT-S map?

There will be some differences in each car depending on the fuel, the temperature not just of the engine itself but of the intercooler and turbo, also how the car has been run in. Also VAG have a history of quoting worst case power output figures in the first place. But those differences will not add 30bhp mate.

We all know that RR outputs are somewhat of a prediction. Some predictions are a bit more realistic than others.
 
I think it's pretty unlikely that several cars with different maps all running on the same day, on the same rolling road would have so much variance.

I mean, all the standard cars were within 10 bhp of each other, which would account for variance in fuel, running in etc, etc.
Whether or not the RR was quoting optimistic figures or not, the fundamental fact is they were all reasonably close together.

For all the chipped cars, the results appear to be the reverse, all below what was expected, again, same RR on the same day, surely, if the road was optimistic on the standard cars, it would also be optimistic on the chipped cars?

I'm really keen to hear of Iggu's experiences when he goes to Superchips and they look in to it. Maybe it will transpire that prosport were coming off the power to early and there was still more toc ome.... who knows, but from what I've seen so far it's all a little perplexing!
 
No I haven't, but I have seen many other RR printouts on this very site claiming 280bhp also. And quite a few people have said they are getting 261 or there abouts. So why do some cars have 261, some 280 and some 290?

Do you really think Audi themselves would want to make the S3 map more powerful than the TT-S map?

There will be some differences in each car depending on the fuel, the temperature not just of the engine itself but of the intercooler and turbo, also how the car has been run in. Also VAG have a history of quoting worst case power output figures in the first place. But those differences will not add 30bhp mate.

I can only remember one person ( no plot ) saying there car made 261bhp , he is a Bluefin owner ( sorry can't remember the members name ) he had a before and after run.

All the other plots and members qouting there figures have been in the region of 280bhp+

Do you not think the TT-S will be more powerful than the book figures claim? i do.

There his a history of the 2.0l TFSI engaine found in the Cupra , Ed 30 and the S3 putting out 20bhp more thab claimed right across the VAG network, the S3 runs different compresion rates and has a larger core intercooler than the Cupra and the ED 30 ( people are transplanting them into there carrs as we speak on Seatcupra.net ) maybe this is the reason the S3 puts out the extra 10bhp.

The proof is there IMHO.

Thanks

p