

VCDS meas. block log is only in one column
- Thread starter Excellion
- Start date
You are using an out of date browser. It may not display this or other websites correctly.
You should upgrade or use an alternative browser.
You should upgrade or use an alternative browser.
I take it you mean the data logging graphs that move?
If so you need VCSope which comes as part of the latest download iirc.
Sent from my iPad using Tapatalk
If so you need VCSope which comes as part of the latest download iirc.
Sent from my iPad using Tapatalk
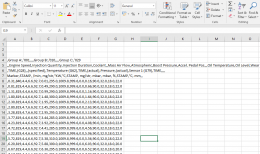
No i mean that i want to make an excel graph with the log information, but all of the information is in only one column and i cant do that. All the logs i have seen each piece of information is in a seperate column
What do you mean ? The screenshot is from excelload the file into excel as a CSV file.. should look better....
- Joined
- May 8, 2016
- Messages
- 433
- Reaction score
- 268
- Points
- 63
what is the suffix on your VCDS log file? .xls / .txt - should be something like that.
change it to .csv and open it with excel again - it should give you the option of opening it as a CSV (Comma Separated Values) file.
it should then look better in excel...
see here - https://www.ablebits.com/office-addins-blog/2014/05/01/convert-csv-excel/
change it to .csv and open it with excel again - it should give you the option of opening it as a CSV (Comma Separated Values) file.
it should then look better in excel...
see here - https://www.ablebits.com/office-addins-blog/2014/05/01/convert-csv-excel/
As above the file needs to be saved and opened as a .csv file.
http://www.ross-tech.com/vcds/tour/logging.php
Looking at the image you posted all the info is there but it's not being displayed correctly in excel.
Also when logging multiple measurements you need to tick the group UDS option or Turbo option to get a decent sample rate. You look to be only getting 2 samples pers second at the moment.
")
Looks like an issue with Excel opening .csv files.
Did a quick google search
http://stackoverflow.com/questions/17953679/how-to-correctly-display-csv-files-within-excel-2013
Did a quick google search
http://stackoverflow.com/questions/17953679/how-to-correctly-display-csv-files-within-excel-2013
Tahnk you! works great nowLooks like an issue with Excel opening .csv files.
Did a quick google search
http://stackoverflow.com/questions/17953679/how-to-correctly-display-csv-files-within-excel-2013