

Don't know how to upload this file properly for you guys to read but do these figures look ok for a standard S4 before I get a remap. Got it Vagcom'ed and these are the results. Can anyone help ?
Tuesday,26,May,2009,22:01:43
8D0 907 551 D,ADVMB,2.7l V6/5VT G 0002,
,,G115,F0,G115,F2,G115,F3,G118,F2,G000,F0,G000,F0,G000,F0,G000,F0,G000,F0,G000,F0,G000,F0,G000,F0,
Marker,TIME,Group 115 - Field 0,TIME,Group 115 - Field 2,TIME,Group 115 - Field 3,TIME,Group 118 - Field 2,,,,,,,,,,,,,,,,,
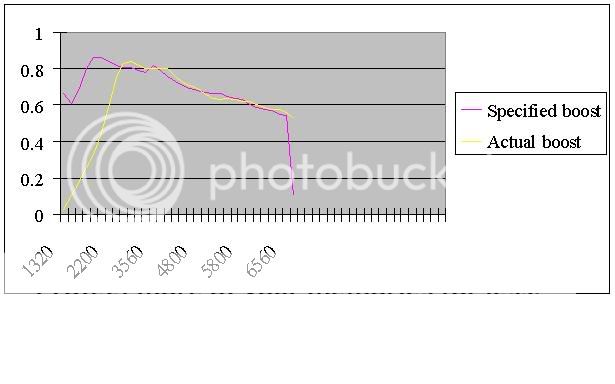
,STAMP,Engine Speed - (G28),STAMP,Boost Pressure - (specified),STAMP,Boost Pressure - (actual),STAMP,Wastegate (N75) - Duty Cycle,,,,,,,,,,,,,,,,,
,, /min,, mbar,, mbar,, %,,,,,,,,,,,,,,,,,
,0.02,1360,0.02,1600.0,0.02,1100.0,0.30,95.3,,,,,,,,,,,,,,,,,
,0.61,1480,0.61,1690.0,0.61,1150.0,0.91,95.3,,,,,,,,,,,,,,,,,
,1.21,1640,1.21,1810.0,1.21,1210.0,1.52,95.3,,,,,,,,,,,,,,,,,
,1.81,1760,1.81,1920.0,1.81,1270.0,2.12,95.3,,,,,,,,,,,,,,,,,
,2.41,1920,2.41,1930.0,2.41,1350.0,2.73,95.3,,,,,,,,,,,,,,,,,
,3.02,2120,3.02,1920.0,3.02,1440.0,3.32,95.3,,,,,,,,,,,,,,,,,
,3.63,2320,3.63,1900.0,3.63,1600.0,3.93,65.5,,,,,,,,,,,,,,,,,
,4.24,2520,4.24,1890.0,4.24,1760.0,4.54,65.1,,,,,,,,,,,,,,,,,
,4.84,2800,4.84,1890.0,4.84,1890.0,5.14,65.9,,,,,,,,,,,,,,,,,
,5.43,3000,5.43,1880.0,5.43,1930.0,5.74,64.7,,,,,,,,,,,,,,,,,
,6.05,3240,6.05,1870.0,6.05,1890.0,6.35,64.3,,,,,,,,,,,,,,,,,
,6.65,3480,6.65,1850.0,6.65,1860.0,6.95,64.3,,,,,,,,,,,,,,,,,
,7.25,3680,7.25,1870.0,7.25,1870.0,7.55,64.7,,,,,,,,,,,,,,,,,
,7.86,3920,7.86,1850.0,7.86,1880.0,8.15,63.5,,,,,,,,,,,,,,,,,
,8.47,4120,8.47,1810.0,8.47,1840.0,8.77,63.1,,,,,,,,,,,,,,,,,
,9.09,4360,9.09,1790.0,9.09,1810.0,9.40,61.2,,,,,,,,,,,,,,,,,
,9.72,4560,9.72,1760.0,9.72,1770.0,10.05,60.8,,,,,,,,,,,,,,,,,
,10.37,4800,10.37,1750.0,10.37,1760.0,10.70,60.4,,,,,,,,,,,,,,,,,
,11.03,5000,11.03,1730.0,11.03,1730.0,11.37,60.4,,,,,,,,,,,,,,,,,
,11.71,5200,11.71,1710.0,11.71,1700.0,12.06,60.8,,,,,,,,,,,,,,,,,
,12.40,5400,12.40,1690.0,12.40,1690.0,12.75,60.8,,,,,,,,,,,,,,,,,
,13.10,5640,13.10,1670.0,13.10,1670.0,13.46,60.4,,,,,,,,,,,,,,,,,
,13.81,5800,13.81,1650.0,13.81,1650.0,14.18,59.2,,,,,,,,,,,,,,,,,
,14.55,6000,14.55,1610.0,14.55,1640.0,14.92,58.4,,,,,,,,,,,,,,,,,
,15.29,6160,15.29,1580.0,15.29,1610.0,15.66,56.5,,,,,,,,,,,,,,,,,
,16.02,6320,16.02,1540.0,16.02,1580.0,16.40,54.5,,,,,,,,,,,,,,,,,
,16.78,6440,16.78,1530.0,16.78,1550.0,17.15,52.9,,,,,,,,,,,,,,,,,
,17.54,6560,17.54,1530.0,17.54,1540.0,17.92,52.9,,,,,,,,,,,,,,,,,
Tuesday,26,May,2009,22:01:43
8D0 907 551 D,ADVMB,2.7l V6/5VT G 0002,
,,G115,F0,G115,F2,G115,F3,G118,F2,G000,F0,G000,F0,G000,F0,G000,F0,G000,F0,G000,F0,G000,F0,G000,F0,
Marker,TIME,Group 115 - Field 0,TIME,Group 115 - Field 2,TIME,Group 115 - Field 3,TIME,Group 118 - Field 2,,,,,,,,,,,,,,,,,
,STAMP,Engine Speed - (G28),STAMP,Boost Pressure - (specified),STAMP,Boost Pressure - (actual),STAMP,Wastegate (N75) - Duty Cycle,,,,,,,,,,,,,,,,,
,, /min,, mbar,, mbar,, %,,,,,,,,,,,,,,,,,
,0.02,1360,0.02,1600.0,0.02,1100.0,0.30,95.3,,,,,,,,,,,,,,,,,
,0.61,1480,0.61,1690.0,0.61,1150.0,0.91,95.3,,,,,,,,,,,,,,,,,
,1.21,1640,1.21,1810.0,1.21,1210.0,1.52,95.3,,,,,,,,,,,,,,,,,
,1.81,1760,1.81,1920.0,1.81,1270.0,2.12,95.3,,,,,,,,,,,,,,,,,
,2.41,1920,2.41,1930.0,2.41,1350.0,2.73,95.3,,,,,,,,,,,,,,,,,
,3.02,2120,3.02,1920.0,3.02,1440.0,3.32,95.3,,,,,,,,,,,,,,,,,
,3.63,2320,3.63,1900.0,3.63,1600.0,3.93,65.5,,,,,,,,,,,,,,,,,
,4.24,2520,4.24,1890.0,4.24,1760.0,4.54,65.1,,,,,,,,,,,,,,,,,
,4.84,2800,4.84,1890.0,4.84,1890.0,5.14,65.9,,,,,,,,,,,,,,,,,
,5.43,3000,5.43,1880.0,5.43,1930.0,5.74,64.7,,,,,,,,,,,,,,,,,
,6.05,3240,6.05,1870.0,6.05,1890.0,6.35,64.3,,,,,,,,,,,,,,,,,
,6.65,3480,6.65,1850.0,6.65,1860.0,6.95,64.3,,,,,,,,,,,,,,,,,
,7.25,3680,7.25,1870.0,7.25,1870.0,7.55,64.7,,,,,,,,,,,,,,,,,
,7.86,3920,7.86,1850.0,7.86,1880.0,8.15,63.5,,,,,,,,,,,,,,,,,
,8.47,4120,8.47,1810.0,8.47,1840.0,8.77,63.1,,,,,,,,,,,,,,,,,
,9.09,4360,9.09,1790.0,9.09,1810.0,9.40,61.2,,,,,,,,,,,,,,,,,
,9.72,4560,9.72,1760.0,9.72,1770.0,10.05,60.8,,,,,,,,,,,,,,,,,
,10.37,4800,10.37,1750.0,10.37,1760.0,10.70,60.4,,,,,,,,,,,,,,,,,
,11.03,5000,11.03,1730.0,11.03,1730.0,11.37,60.4,,,,,,,,,,,,,,,,,
,11.71,5200,11.71,1710.0,11.71,1700.0,12.06,60.8,,,,,,,,,,,,,,,,,
,12.40,5400,12.40,1690.0,12.40,1690.0,12.75,60.8,,,,,,,,,,,,,,,,,
,13.10,5640,13.10,1670.0,13.10,1670.0,13.46,60.4,,,,,,,,,,,,,,,,,
,13.81,5800,13.81,1650.0,13.81,1650.0,14.18,59.2,,,,,,,,,,,,,,,,,
,14.55,6000,14.55,1610.0,14.55,1640.0,14.92,58.4,,,,,,,,,,,,,,,,,
,15.29,6160,15.29,1580.0,15.29,1610.0,15.66,56.5,,,,,,,,,,,,,,,,,
,16.02,6320,16.02,1540.0,16.02,1580.0,16.40,54.5,,,,,,,,,,,,,,,,,
,16.78,6440,16.78,1530.0,16.78,1550.0,17.15,52.9,,,,,,,,,,,,,,,,,
,17.54,6560,17.54,1530.0,17.54,1540.0,17.92,52.9,,,,,,,,,,,,,,,,,