
- Joined
- Dec 2, 2008
- Messages
- 17,400
- Reaction score
- 1,104
- Points
- 113
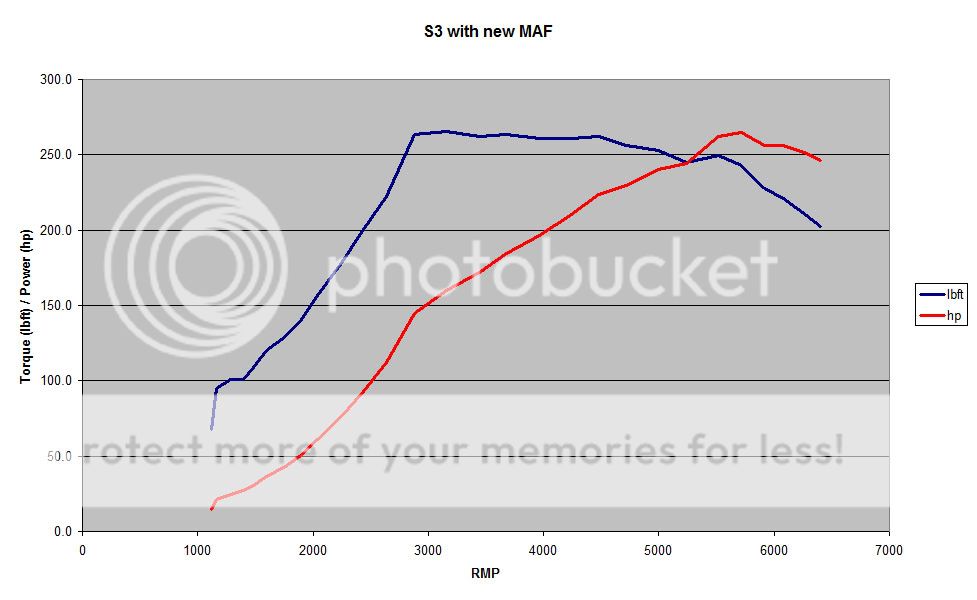
Deece posted up the guide to do this from Ross-Tech's website last week so I thought I'd gove it a go. This is what I got:

For those of you that have had dyno graphs done and or have done this graph in VAGCOM can you tell me if it looks ok?
I hit max power of 221HP at 5700rpm and max torque of 227lbft at 4500rpm
For those of you that have had dyno graphs done and or have done this graph in VAGCOM can you tell me if it looks ok?
I hit max power of 221HP at 5700rpm and max torque of 227lbft at 4500rpm
")